Physical Aquatic Habitat Assessment Data, Ozark
Plateaus, Missouri and Arkansas
By Robert B. Jacobson, Harold E. Johnson, Joanna M. Reuter,
and Maria Panfil Wright
U.S. Geological Survey Data Series DS - 94
This report presents data from two
related studies on physical habitat in small streams in the Ozark Plateaus
Physiographic Province of
Missouri and Arkansas. Seventy
stream reaches and their contributing drainage basins were assessed using a
physical habitat protocol designed to optimize understanding of how stream
reach characteristics relate to drainage-basin characteristics.
Drainage-basin characteristics were evaluated using geographic
information system (GIS) techniques and datasets designed to evaluate the
geologic, physiographic, and land-use characteristics of encompassing drainage
basins. Reach characteristics
were evaluated using a field-based geomorphology and habitat protocol.
The data are intended to complement ecological studies on Ozark
Plateaus streams.
During 1998 –
2003 USGS geomorphologists were engaged in research studies to explore the
extent to which stream physical habitat characteristics in the Ozark Plateaus
(Ozarks, fig. 1) have been affected by land-use practices.
Synoptic assessments can address the spatial relations between a stream
and characteristics of its contributing drainage area and develop statistical
measures of association. In the
Ozarks, a region characterized by relatively high spatial variability and
relatively low land-use stress, the measures of association are typically weak
(Panfil and Jacobson, 2001). In
addition to the spatial variability and low land-use stress, non-uniform and
lagged historical effects of land uses on streams have been blamed for the
lack of strong contemporary associations (see, Jacobson, in press; Jacobson
and Primm, 1997; Jacobson and Gran, 1999).
Many protocols
have been proposed for evaluation of physical stream geomorphology and
physical habitat (for example, Bain and Stevenson, 1999).
Physical habitats typically are evaluated for two related reasons. The first is to provide additional explanatory variables for
assessments of stream ecology or water quality. The second is to explore relations between the stream and
drainage-basin characteristics, usually with the intention of understanding
land-use effects. The first
approach is optimized if the habitat variables measured relate spatially and
temporally to the specific biological or water-quality samples, both of which
can be heavily dependent on the stream discharge at the time of sampling.
In contrast, the second approach seeks to minimize the effects of
discharge and measure variables that are longer-term integrators of geomorphic
responses. The habitat protocol developed for this study is the
latter type (Panfil and Jacobson, 2001).
|
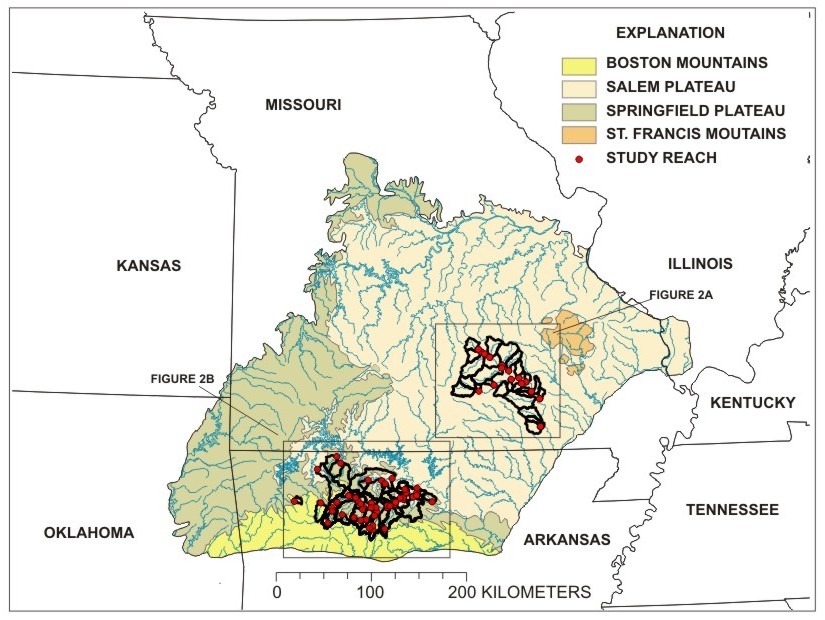
Figure 1. Map showing distributions of study basins and reaches within physiographic divisions of the Ozark Plateaus Province.
This report is
intended as the repository for data included in Panfil and Jacobson (2001) for
tributaries to the Buffalo River, northern Arkansas and the Current River in
southern Missouri (fig. 2A, B). Data
are also presented for additional drainage basins in northern Arkansas,
including some representative of forested areas in the Boston
Mountains, and areas characterized by high percentages of cleared and
agricultural land outside of the Buffalo River basin (fig. 2B).
All habitat data were collected using the protocol defined in Panfil
and Jacobson (2001).

Figure 2A. Drainage basins and reach-scale data collection locations for selected tributaries to the Current River, southern Missouri. Drainage basins with green location markers have only basin-characteristics data; red location markers indicate both basin and reach characteristics data (Panfil and Jacobson, 2001).

Figure 2B. Drainage basins and reach-scale data collection locations for selected tributaries to the Buffalo River and adjacent areas, northern Arkansas. MS, mainstem; L, lower; U, upper; M, middle; E., east.
Methods
Two types of
data are presented here. Drainage-basin
characterization data were derived from topographic, geologic, hydrographic,
and land-use spatial data for individual study basins.
The drainage basins were defined as the contributing drainage area upstream of
the upstream end of the study reach. Drainage-basin
characterization datasets, derivation of drainage-basin variables, and
prioritization of variables are detailed in Panfil and Jacobson (2001).
These variables consist of physiographic, topographic, geologic, and
land-use variables (table 1).
Table
1 . Drainage-basin variables,
definitions, and data sources
[m,
meters; m2, square meters; km2, square kilometers]
|
| Drainage-Basin
Variables |
Definition |
Data
Source |
Geology
|
|
Formation area, as a proportion |
Area of each chronstratigraphic unit summed and divided
by drainage area. |
1:500,000-scale state geologic map of Missouri (Missouri
Department of Natural Resources, 1991)
modified 1:500,000-scale state geologic map of Arkansas
(Hofer and others, 1995) Map was tiled from 1:24,000-scale and coarser
resolution data. Cells were reclassified to match geologic categories on
the statewide 1:500,000-scale geologic by Haley and others (1993).
|
|
Carbonate bedrock area, as a proportion |
Formations regrouped by dominant lithology; area with
carbonate bedrock summed and divided by drainage area. |
Physiography
|
|
Drainage area (m2 or km2)
|
Total area upstream of upper end of study reach;
drainage basin boundaries delineated using an ArcView Spatial Analyst
Script (http://gis.esri.com/arcscripts/details.cfm?CFGRIDKEY=951497255)
and refined by comparison with elevation contours on USGS 1:24,000
digital raster graphics. |
30-meter resolution digital elevation model, tiled from
1:24,000 USGS quadrangle sheets (U.S. Geological
Survey, 2000a) and 1:24,000-scale digital raster graphics
(U.S. Geological Survey, 1999)
|
|
Drainage-basin shape factor |
Basin length squared divided by drainage area
where basin length is the total length of a line bisecting the major
river valley, from the upper end of the study reach to the drainage
divide. |
|
Elevation range (m) |
Highest minus lowest elevation in study drainage basin. |
|
Drainage-basin average slope (degrees) |
Average slope for all grid cells within a study drainage
basin where slope is calculated by comparison of each cell’s elevation
to that of the surrounding eight cells. |
|
Bluff area in stream buffer, as a proportion |
Area of cells with slopes greater than 30 degrees within
a stream buffer, divided by the buffer area. Buffers had graduated
widths based on the Strahler stream order. First order streams had a
buffer width of 25 m on each side of the stream. Width increased by an
additional 25 m for each sequential stream order up to a maximum of 300
m. |
Soils
|
|
No variables selected. |
1:250,000-scale STATSGO soils coverage (U.S. Department
of Agriculutre, 1994a, 1994b) |
Stream Network
|
|
No variables selected. |
1:100,000-scale rf3 river reach files (U.S.
Environmental Protection Agency, 1998)
|
|
Land Cover
|
|
Cleared land area, as a proportion |
Sum of area classified as developed, shrubland,
transitional, herbaceous upland, or herbaceous cultivated (NLCD
categories 33,51,71,81,82,83,84,85), divided by drainage area. |
30-meter resolution National Land Cover Data (NLCD)
(U.S. Geological Survey, 2000b)
Coverage for the state of Arkansas was based on Landsat
Thematic Mapper (TM) scenes taken from April 1988 through December 1993.
Coverage for the state of Missouri was based on scenes
taken from March 1988 through October 1993 (see Panfil and Jacobson,
2001, Appendix 1 for more details). |
|
Steep, cleared land area, as a proportion |
Cleared land area on slopes greater than seven degrees
divided by drainage area (calculated by reclassifying and merging
NLCD and slope grids). |
|
Cleared land area in stream buffer, as a proportion |
Cleared land area within stream buffers divided by total
drainage area. See definition of bluff area for buffer
explanation. |
Road Network
|
|
Road density (m/m2) |
Total road length within a basin divided by drainage
area. |
1:100,000-scale TIGER/Line files (U. S. Census Bureau,
1992) |
|
Road density in stream buffer (m/m2) |
Total road length within a stream buffer divided by
buffer area. See definition of bluff area for buffer explanation. |
Stewardship and Political
|
|
Private land area, as a proportion |
Area outside of state, federal, or Nature Conservancy
land management areas divided by drainage area. |
1:100,000-scale stewardship boundaries
(Center for Advanced Spatial Technologies, 1998) and (Missouri
Resource Assessment Partnership, 1997)
|
|
Cities and towns on reference maps |
|
1:2,000,000-scale city and town locations from the
National Atlas (U.S. Geological Survey, 2000c
) |
|
Reach-scale
data were collected in the field in reaches selected to be representative of
the tributary. In the Current River
(Missouri) study, reaches were selected at junctions between the tributary and
mainstem Current River; reaches were delineated far enough upstream to avoid
backwater effects from the mainstem. In the Buffalo River drainage basin
and adjacent area, tributary reaches were complemented with satellite,
headwater, out-of-basin, and mainstem reaches. At four tributaries in
the Arkansas dataset, satellite reaches were chosen 1-3 km upstream of the
tributary reach to evaluate mainstem effects on fish community
structure. Ten headwater reaches (including one on the mainstem Buffalo
River) were selected to sample small, steep,
forested drainage basins in the Boston Mountains. Ten out-of-basin
reaches were selected outside of the Buffalo River drainage basin to sample an
increased range of agricultural land use. Nine additional reaches were selected on
the Buffalo River mainstem to explore longitudinal effects. Reach selection
was also constrained in part by access; most reaches are on Federal- or
State-owned land. Reaches were
delineated to include (whenever possible) a sequence of four riffles and three
intervening pools (Figs. 3, 4). In all
cases, reaches were at least 20 bankfull widths long. The
reach-scale data include measures of channel morphology, longitudinal profile, sediment
characteristics, and extent of erosion (table 2).
The habitat protocol focuses on glide habitat units (fig. 4) for
bankfull channel morphology and sediment characteristics in order to minimize
within-reach variability. Details
of the reach-scale habitat protocol can be found in Panfil and Jacobson
(2001).
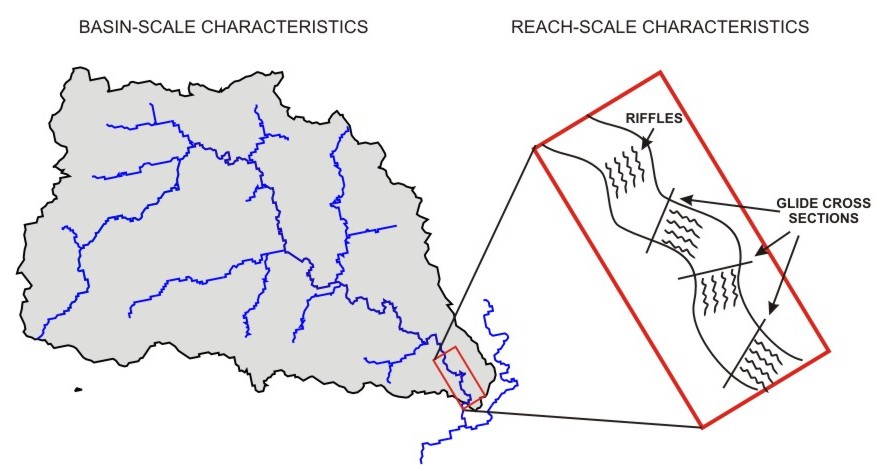
Figure
3.
Two scales of data collection |
Table
2. Reach-scale variables, definitions,
and measurement techniques
|
|
Reach-scale
Variable
|
Definition
|
Measurement
Technique
|
Channel Geometry
|
|
Reach gradient |
Slope of a best-fit line through water surface points
surveyed along the thalweg. |
Calculated from the geometry of the longitudinal profile
survey, see Figure 4. |
|
Total residual pool length (m) |
Total length of reach within residual pools. |
|
Residual pools, as a proportion |
Total residual pool length
divided by total reach length. |
|
Average residual pool length (m) |
Total residual pool length
divided by the number of residual pools. |
|
Average residual pool depth (m) |
Residual pool area (measured along longitudinal profile)
divided by total residual pool length. |
|
|
Pools, as a proportion of reach length |
Total reach length classified as lateral, bluff,
mid-channel or obstruction pools divided by total reach length. |
Calculated from visual identifications of habitat type
made at each survey point along the longitudinal profile. See Figure 6
for habitat classification criteria. |
|
Glides, as a proportion of reach length |
Total reach length classified as glides divided by total
reach length. |
|
Obstruction pools, as a proportion of reach length |
Total reach length classified as obstruction pools
divided by total reach length classified as pools. |
|
|
Average bankfull channel width (m) |
Total distance across channel at bankfull elevation;
average from 3-6 cross sections. |
Calculated from the geometry of surveyed cross sections.
Bankfull elevation was projected into cross sections from indicators
identified throughout the study reach. |
|
Average bankfull channel depth (m) |
Bankfull channel area divided by bankfull channel
width; average from 3-6 cross sections. |
|
Substrate
|
|
Mud/sand along thalweg, as a proportion of reach length |
Dominant particle size <2 mm; total reach length
classified as mud/sand divided by total reach length. |
Calculated from visual estimates of dominant particle
size and embeddedness at each survey point along the longitudinal
profile. Estimate made within a one meter diameter circle around the
base of the surveyor’s stadia rod. Embeddedness reported as the
proportion of the circle covered with mud or sand, in intervals of 0.1. |
|
Gravel along thalweg, as a proportion of reach length |
Dominant particle size 2-64 mm; total reach length
classified as gravel divided by total reach length. |
|
Cobbles and boulders along thalweg, as a proportion of
reach length |
Dominant particle size >64 mm; total reach length
classified as cobbles/boulders divided by total reach length. |
|
|
Thalweg embeddedness index |
Summation of embeddedness class times the proportion of
reach length within each embeddedness class. |
Visual estimation |
|
|
Glide D16 (mm) |
16th percentile of particle size
distribution; average from three glides. |
Calculated from cumulative particle size distributions
from pebble counts of 100 particles. |
|
Glide D50 (mm) |
50th percentile of particle size
distribution; average from three glides. |
|
Glide D84 (mm) |
84th percentile of particle size
distribution; average from three glides. |
|
Glide sorting (phi) |
(D84 – D16)/4 + (D95-D5)/6); where particle sizes were
transformed to phi (-log2(diameter, mm)) and D84, D16, D95,
and D5 are equal to 84th , 16th, 95th,
and 5th percentiles of particle size distribution in glides. |
|
|
Glide embeddedness, as a proportion |
Average of embeddedness from two locations in each of
three glides. |
The proportion of a 60 cm quadrant covered with mud or
sand, reported in intervals of 0.05. |
Channel Stability
|
|
Bank vegetation index |
Summation of vegetation class times the proportion of
reach length within each embeddedness class; average of left and right
banks. |
Calculated from visual estimates made at each survey
point along the longitudinal profile. Observations made of vertical
banks below bankfull elevation. |
|
Severely eroding banks, as a proportion of reach length |
Total reach length classified as severely eroding
divided by total reach length; average of left and right banks. |
|
Moderately and severely eroding banks, as a proportion
of reach length |
Total reach length classified as moderately or severely
eroding divided by total reach length; average of left and right banks. |
|
|
Reach sinuosity |
Total reach length divided by straight line distance
between endpoints. |
Calculated from planview of longitudinal profile survey. |
|
|
Glide canopy cover |
Average from densiometer readings at both ends of 3-6
cross sections. |
Calculated from concave spherical densiometer readings
near water’s edge on each cross section. Methodology followed
Fitzpatrick and others (1998). |
|

Figure 4. Scheme for data collection at
the reach scale, showing planform, longitudinal profile, and hydraulic habitat
units. |
Results
 Table 3. Drainage-basin and reach
characteristic data file in Excel format
Table 3. Drainage-basin and reach
characteristic data file in Excel format
 Table 3. Drainage-basin and reach
characteristic data file in comma delimited format
Table 3. Drainage-basin and reach
characteristic data file in comma delimited format
Literature Cited
Bain,
M. B., and N. J. Stevenson, 1999, Aquatic Habitat Assessment: Common Methods,
American Fisheries Society Bethesda, MD, 216 pp.
Center
for Advanced Spatial Technologies, 1998, AR-GAP Land Stewardship of Arkansas,
University of Arkansas: http://www.cast.uark.edu/gap/ .
Fitzpatrick,
F.A., Waite, I.R., D’Arconte, P.J., Meador, M.R., Maupin, M.A., and Gurtz, M.E.,
1998, Revised Methods for Characterizing Stream Habitat in the National
Water-Quality Assessment Program; U.S. Geological Survey Water-Resources
Investigations Report 98-4052, 67 pages.
Haley,
B.R., Glick, E.E., Bush, W.V., Clardy, B.F., Stone, C.G., Woodward, M.B.,
Zachary,
D.L., 1993, Geologic map of Arkansas: U.S. Geological Survey and Arkansas
Geological Commission, map revised from 1976 version
Hofer,
K.R. Scott, H.D., and McKimmey, J.M., 1995, Spatial distribution of the surface
geology and 1992 land use of the Buffalo River Watershed: Arkansas Water
Resources Center Publication, no. 174, pg.43.
Jacobson,
R.B., in press, Watershed Sustainability: Downstream Effects of Timber Harvest
in the Ozarks of Missouri, in, Flader, S.J., ed., Toward Sustainability for
Missouri Forests, USDA Forest Service North Central Experiment Station General
Technical Publication. 27 ms. pages.
Jacobson,
R.B. and Gran, K.B., 1999, Gravel routing from widespread, low-intensity
landscape disturbance, Current River Basin, Missouri: Earth Surface Processes
and Landforms, v. 24, 897-917.
Jacobson,
R.B. and Primm, A.T., 1997, Historical land-use changes and potential effects on
stream disturbance in the Ozark Plateaus, Missouri: U.S. Geological Survey
Water-Supply Paper 2484, 85 p.
Missouri
Department of Natural Resources, 1991, Geologic map of Missouri,
1:500,000-scale: http://msdisweb.missouri.edu/datasearch/metadata/utm/st_geol_utm.xml.
Missouri
Resource Assessment Partnership, 1997, Stewardship: http://www.cerc.cr.usgs.gov/morap/projects.asp.
Panfil,
M.S., and Jacobson, R.B., 2001, Relations among geology, physiography, land use,
and stream habitat conditions in the Buffalo and Current River systems, Missouri
and Arkansas: U.S. Geological Survey Biological Sciences
Report, USGS/BRD/BSR-2001-0005, 111 p. On CD-ROM or online at: http://www.cerc.usgs.gov/pubs/center/pdfDocs/bsr2001-0005.pdf.
U.S.
Census Bureau, 1992, TIGER/Line files for the Continental United States, scale
1:100,000: http://www.census.gov/mp/www/rom/msrom12f.html.
U.S.
Department of Agriculture, 1994a, State Soil Geographic (STATSGO) data base for
Missouri, scale 1:250,000: http://www.ncgc.nrcs.usda.gov/branch/ssb/products/statsgo/index.html.
U.S.
Department of Agriculture, 1994b, State Soil Geographic (STATSGO) data base for
Arkansas, scale 1:250,000: http://www.ncgc.nrcs.usda.gov/branch/ssb/products/statsgo/index.html.
U.S.
Environmental Protection Agency, 1998, USEPA/OW River Reach File 3 for the
Continental United States, scale 1:100,000: http://www.epa.gov/waters/doc/rfindex.html
.
U.S.
Geological Survey, 1999, Digital Raster Graphics, Fact Sheet 070-99: http://mac.usgs.gov/mac/isb/pubs/factsheets/fs08801.html.
U.S.
Geological Survey, 2000a, US GeoData Digital Elevation Models, Fact
Sheet 040-00: http://mapping.usgs.gov/mac/isb/pubs/factsheets/fs04000.html.
U.S.
Geological Survey, 2000b, National Land Cover Data, 30-meter resolution: http://edcsgs9.cr.usgs.gov/programs/lccp/nationallandcover.html.
U.S.
Geological Survey, 2000c; National Atlas: http://www.nationalatlas.gov/atlasftp.html.
Webpage
content contact: Robert Jacobson.
Webmaster: Chris Henke
|